This passage describes some activities of the U.S. Department of Agriculture (USDA).
The U.S. Department of Agriculture Risk Management Agency oversees the Commodity Insurance program. This program offers farmers a variety of forms of insurance. One form is known as the Revenue Protection Plan. This plan protects farmers against losing income due to falling prices or crop failures.
Under this plan, a farmer may choose to purchase insurance to guarantee revenue of at least 75% of the Actual Production History of the farm. The insurance on some crops, such as corn, is subsidized by the federal government at a much higher rate than most other crops. The insurance rates vary depending on the type of crop grown.
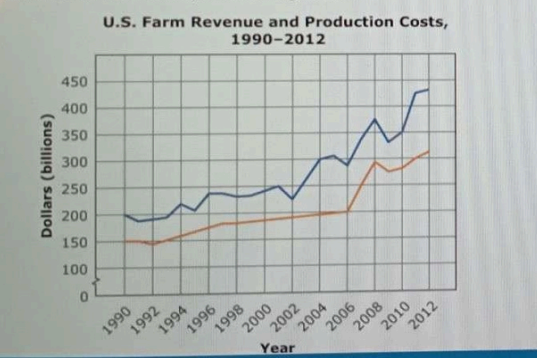
The USDA also has several agencies devoted to research. The Economic Research Service complies data about the total profits earned by U.S. farms. It measures the total income earned by farms and the total costs of production. Generally, both figures have increased over the past 10 years. This graph contains data from the U.S. Department of Agriculture.
According to the information in the first graph, which statement correctly describes the period from 2006 to 2008?
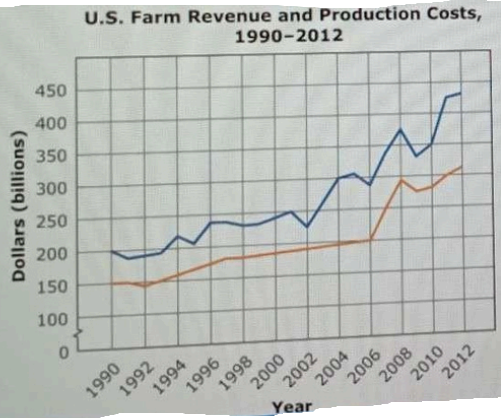
- A. Gross farm income continued the decline that had characterized previous years.
- B. Gross farm income increased despite increases in production costs.
- C. Increases in production costs caused gross farm income to decline.
- D. Decreases in production costs continued throughout this period.
Correct Answer & Rationale
Correct Answer: B
During the period from 2006 to 2008, gross farm income saw an increase, even as production costs rose. This indicates that farmers managed to offset higher expenses with increased revenue. Option A is incorrect as it suggests a continuation of decline, which contradicts the data showing growth in income. Option C misinterprets the relationship between rising costs and income, as income actually increased despite those costs. Option D is inaccurate because it implies a consistent decrease in production costs, which is not supported by the graph indicating rising expenses during this timeframe.
During the period from 2006 to 2008, gross farm income saw an increase, even as production costs rose. This indicates that farmers managed to offset higher expenses with increased revenue. Option A is incorrect as it suggests a continuation of decline, which contradicts the data showing growth in income. Option C misinterprets the relationship between rising costs and income, as income actually increased despite those costs. Option D is inaccurate because it implies a consistent decrease in production costs, which is not supported by the graph indicating rising expenses during this timeframe.
Other Related Questions
How does the U.S. Supreme Court's ruling differ from Justice Murphy's dissent?
- A. Only Justice Murphy's dissent acknowledged the dangers to the United States of having citizens from foreign lands.
- B. Only the Court's ruling acknowledged that the actions of fearful U.S. authorities can endanger the civil rights of citizens.
- C. Only the Court's ruling contended that Korematsu was ordered held in an internment camp because he was disloyal to the United States during time of war.
- D. Only Justice Murphy's dissent contended that U.S. internment camps were a clear-cut example of racial prejudice.
Correct Answer & Rationale
Correct Answer: D
Justice Murphy's dissent emphasized that the internment camps represented blatant racial prejudice, highlighting the unjust targeting of Japanese Americans based solely on their ethnicity. This perspective contrasts sharply with the majority opinion, which focused on national security concerns without addressing the racial implications. Option A is incorrect as both perspectives recognize the potential dangers of foreign nationals, albeit in different contexts. Option B misrepresents the majority's stance, which did not explicitly acknowledge civil rights violations. Option C inaccurately simplifies the Court's ruling, which did not solely attribute internment to disloyalty.
Justice Murphy's dissent emphasized that the internment camps represented blatant racial prejudice, highlighting the unjust targeting of Japanese Americans based solely on their ethnicity. This perspective contrasts sharply with the majority opinion, which focused on national security concerns without addressing the racial implications. Option A is incorrect as both perspectives recognize the potential dangers of foreign nationals, albeit in different contexts. Option B misrepresents the majority's stance, which did not explicitly acknowledge civil rights violations. Option C inaccurately simplifies the Court's ruling, which did not solely attribute internment to disloyalty.
Which feature of the U.S. system of government did de Tocqueville believe might cause conflict in society?
- A. The majority is able to achieve special rights.
- B. The minority is able to block popular legislation.
- C. Legislators must represent minority interests.
- D. Legislators sometimes act against majority rule.
Correct Answer & Rationale
Correct Answer: A
De Tocqueville observed that when the majority in a democracy can impose its will, it might lead to the oppression of minority groups, creating societal conflict. This reflects his concern about "tyranny of the majority," where the dominant group's interests overshadow the rights of others. Option B is incorrect because while minorities can influence legislation, de Tocqueville focused more on majority power. Option C misrepresents his views; he acknowledged the importance of minority representation but did not see it as a source of conflict. Option D is also inaccurate, as de Tocqueville emphasized the potential for the majority to dominate rather than legislators opposing the majority.
De Tocqueville observed that when the majority in a democracy can impose its will, it might lead to the oppression of minority groups, creating societal conflict. This reflects his concern about "tyranny of the majority," where the dominant group's interests overshadow the rights of others. Option B is incorrect because while minorities can influence legislation, de Tocqueville focused more on majority power. Option C misrepresents his views; he acknowledged the importance of minority representation but did not see it as a source of conflict. Option D is also inaccurate, as de Tocqueville emphasized the potential for the majority to dominate rather than legislators opposing the majority.
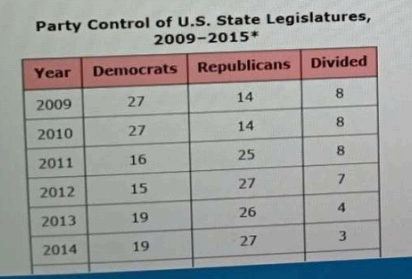
Which statement can be made based on both the passage and the table?
- A. The increase in independent voters has strengthened the influence of Democrats on the national level.
- B. The best political campaigns of Republicans and Democrats use modern media to communicate with voters.
- C. The most recent data shows that Republicans controlled almost three times the number of state legislatures as Democrats.
- D. The decrease in party identification has strengthened the influence of Republicans in state legislatures.
Correct Answer & Rationale
Correct Answer: B
Option B accurately reflects the information provided in both the passage and the table, highlighting the importance of modern media in effective political campaigns for both major parties. This statement emphasizes a shared strategy that transcends partisan lines, indicating a common approach to engaging voters. Option A incorrectly suggests a direct correlation between independent voters and the strengthening of Democrats, which is not supported by the data. Option C misrepresents the statistics regarding state legislature control, as the table likely shows a different ratio. Option D assumes that a decrease in party identification universally benefits Republicans, ignoring the complexities of voter behavior and preferences that the passage may address.
Option B accurately reflects the information provided in both the passage and the table, highlighting the importance of modern media in effective political campaigns for both major parties. This statement emphasizes a shared strategy that transcends partisan lines, indicating a common approach to engaging voters. Option A incorrectly suggests a direct correlation between independent voters and the strengthening of Democrats, which is not supported by the data. Option C misrepresents the statistics regarding state legislature control, as the table likely shows a different ratio. Option D assumes that a decrease in party identification universally benefits Republicans, ignoring the complexities of voter behavior and preferences that the passage may address.
What impact do the varying insurance rates of the Revenue Protection Plan have on farming?
- A. They maintain stable prices for certain crops.
- B. They give farmers an incentive to promote crop diversity.
- C. They ensure the steady increase of crop production levels.
- D. They give farmers an incentive to grow crops that have higher subsidies.
Correct Answer & Rationale
Correct Answer: D
The varying insurance rates of the Revenue Protection Plan incentivize farmers to cultivate crops that receive higher subsidies, as these crops can mitigate financial risks associated with farming. This option aligns with economic behavior, where farmers are likely to prioritize profitability. Option A is incorrect because insurance rates do not directly stabilize prices; they primarily provide financial protection. Option B misrepresents the incentive structure; while crop diversity is beneficial, the plan does not specifically encourage it through varying rates. Option C is misleading, as the plan does not guarantee increased production levels; it merely provides a safety net against revenue loss.
The varying insurance rates of the Revenue Protection Plan incentivize farmers to cultivate crops that receive higher subsidies, as these crops can mitigate financial risks associated with farming. This option aligns with economic behavior, where farmers are likely to prioritize profitability. Option A is incorrect because insurance rates do not directly stabilize prices; they primarily provide financial protection. Option B misrepresents the incentive structure; while crop diversity is beneficial, the plan does not specifically encourage it through varying rates. Option C is misleading, as the plan does not guarantee increased production levels; it merely provides a safety net against revenue loss.