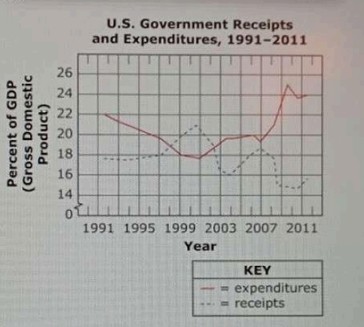
The data in the graph is from the U.S. Department of Commerce.
According to this graph, in which year did the U.S. government first achieve a budget surplus?
- A. 1996
- B. 1994
- C. 1998
- D. 2002
Correct Answer & Rationale
Correct Answer: C
The graph indicates that the U.S. government first achieved a budget surplus in 1998, as evidenced by the line crossing above the zero mark in that year. Option A (1996) shows a deficit, as the line remains below zero. Option B (1994) also reflects a deficit, indicating that the government had not yet balanced its budget. Option D (2002) is incorrect as it depicts a return to deficit after a surplus, confirming that the surplus was achieved earlier in 1998. Thus, 1998 is the first year when the budget surplus was realized.
The graph indicates that the U.S. government first achieved a budget surplus in 1998, as evidenced by the line crossing above the zero mark in that year. Option A (1996) shows a deficit, as the line remains below zero. Option B (1994) also reflects a deficit, indicating that the government had not yet balanced its budget. Option D (2002) is incorrect as it depicts a return to deficit after a surplus, confirming that the surplus was achieved earlier in 1998. Thus, 1998 is the first year when the budget surplus was realized.
Other Related Questions
Which statement is supported by the diagrams?
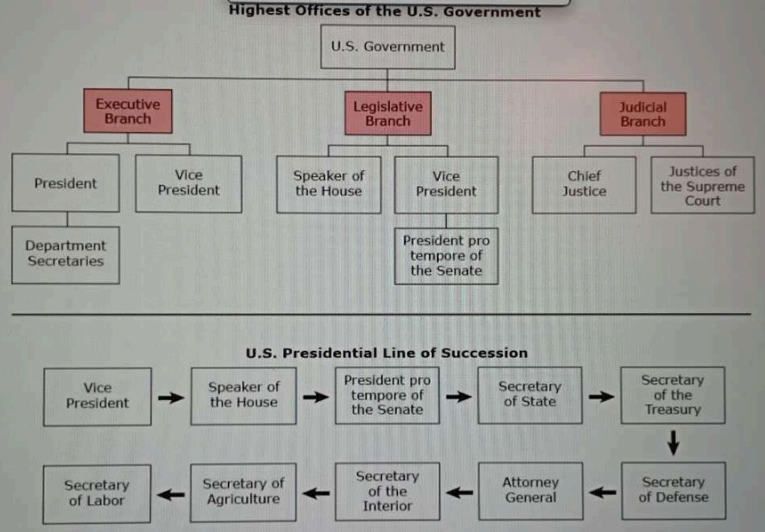
- A. Only the vice president and the president pro tempore of the Senate serve in two branches.
- B. Only officials from the executive and legislative branches are in the line of presidential succession.
- C. The order of presidential succession is determined by the members of the executive branch.
- D. The leaders of Congress are accountable to the members of the executive branch.
Correct Answer & Rationale
Correct Answer: B
Option B accurately reflects the structure of presidential succession, which includes officials from both the executive and legislative branches, specifically the vice president and the leaders of Congress. Option A is misleading; while the vice president and president pro tempore serve in both branches, other officials in the line of succession also include members from the cabinet, which is part of the executive branch. Option C is incorrect as the order of succession is established by law, not determined solely by the executive branch members. Option D misrepresents accountability; Congress leaders are accountable to their constituents, not the executive branch.
Option B accurately reflects the structure of presidential succession, which includes officials from both the executive and legislative branches, specifically the vice president and the leaders of Congress. Option A is misleading; while the vice president and president pro tempore serve in both branches, other officials in the line of succession also include members from the cabinet, which is part of the executive branch. Option C is incorrect as the order of succession is established by law, not determined solely by the executive branch members. Option D misrepresents accountability; Congress leaders are accountable to their constituents, not the executive branch.
Which statement from the excerpts provides evidence for the Inference that minority rights were not protected by the U.S. government as originally founded?
- A. "To the contrary, the government they devised was defective from the start, requiring several amendments, a civil war, and momentous social transformation to attain the system of constitutional government, and its respect for the individual freedoms and human rights, we hold as fundamental today."
- B. "In a very real sense, it was then, in 1787, that the Revolution truly began."
- C. "I do not believe that the meaning of the Constitution was forever 'fixed' at the Philadelphia Convention."
- D. "For it was with the writing of our Constitution, setting down the architecture of democratic government, that the noble sentiments and brave rhetoric of 1776 took on substance......"
Correct Answer & Rationale
Correct Answer: A
Option A highlights the inherent flaws in the original government structure, indicating that it required significant amendments and a civil war to address fundamental issues, including the protection of minority rights. This suggests that, from its inception, the government did not adequately safeguard these rights. Options B, C, and D, while relevant to the historical context, do not specifically address the inadequacies of minority rights protection. B focuses on the ongoing nature of the Revolution, C discusses the evolving interpretation of the Constitution, and D emphasizes the establishment of democratic principles without mentioning the lack of protections for minority rights.
Option A highlights the inherent flaws in the original government structure, indicating that it required significant amendments and a civil war to address fundamental issues, including the protection of minority rights. This suggests that, from its inception, the government did not adequately safeguard these rights. Options B, C, and D, while relevant to the historical context, do not specifically address the inadequacies of minority rights protection. B focuses on the ongoing nature of the Revolution, C discusses the evolving interpretation of the Constitution, and D emphasizes the establishment of democratic principles without mentioning the lack of protections for minority rights.
Which statement from the passage is an opinion?
- A. "The ill-advised rush to extract new discoveries of shale oil and natural gas is a case in point."
- B. "...if the result is polluted water and ghost towns, it is not a sustainable model."
- C. “‘Sustainability' means using natural resources responsibly so that they are available to future generations."
- D. "... to achieve sustainability a business will not view profit only in terms of dollars."
Correct Answer & Rationale
Correct Answer: A
Option A expresses a subjective viewpoint about the extraction of shale oil and natural gas, labeling it as "ill-advised." This indicates a personal judgment rather than an objective fact. In contrast, Option B presents a consequence of unsustainable practices, framing it as a logical outcome rather than an opinion. Option C defines "sustainability" in a factual manner, outlining its meaning without personal bias. Lastly, Option D describes a business approach towards sustainability, focusing on a principle rather than expressing a personal belief. Thus, A stands out as the only statement rooted in opinion.
Option A expresses a subjective viewpoint about the extraction of shale oil and natural gas, labeling it as "ill-advised." This indicates a personal judgment rather than an objective fact. In contrast, Option B presents a consequence of unsustainable practices, framing it as a logical outcome rather than an opinion. Option C defines "sustainability" in a factual manner, outlining its meaning without personal bias. Lastly, Option D describes a business approach towards sustainability, focusing on a principle rather than expressing a personal belief. Thus, A stands out as the only statement rooted in opinion.
How does the U.S. Supreme Court's ruling differ from Justice Murphy's dissent?
- A. Only Justice Murphy's dissent acknowledged the dangers to the United States of having citizens from foreign lands.
- B. Only the Court's ruling acknowledged that the actions of fearful U.S. authorities can endanger the civil rights of citizens.
- C. Only the Court's ruling contended that Korematsu was ordered held in an internment camp because he was disloyal to the United States during time of war.
- D. Only Justice Murphy's dissent contended that U.S. internment camps were a clear-cut example of racial prejudice.
Correct Answer & Rationale
Correct Answer: D
Justice Murphy's dissent emphasized that the internment camps represented blatant racial prejudice, highlighting the unjust targeting of Japanese Americans based solely on their ethnicity. This perspective contrasts sharply with the majority opinion, which focused on national security concerns without addressing the racial implications. Option A is incorrect as both perspectives recognize the potential dangers of foreign nationals, albeit in different contexts. Option B misrepresents the majority's stance, which did not explicitly acknowledge civil rights violations. Option C inaccurately simplifies the Court's ruling, which did not solely attribute internment to disloyalty.
Justice Murphy's dissent emphasized that the internment camps represented blatant racial prejudice, highlighting the unjust targeting of Japanese Americans based solely on their ethnicity. This perspective contrasts sharply with the majority opinion, which focused on national security concerns without addressing the racial implications. Option A is incorrect as both perspectives recognize the potential dangers of foreign nationals, albeit in different contexts. Option B misrepresents the majority's stance, which did not explicitly acknowledge civil rights violations. Option C inaccurately simplifies the Court's ruling, which did not solely attribute internment to disloyalty.