Graph: pumpkin weights.
Answerable?
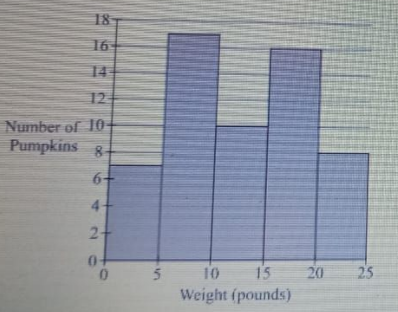
- A. 4.5 pounds?
- B. At least 15?
- C. Less than 8?
- D. 6-12 pounds?
Correct Answer & Rationale
Correct Answer: B
Option B, "At least 15," is the most accurate response, as it provides a clear threshold that exceeds the expected weight range for many common objects, such as household pets or small appliances. Option A, "4.5 pounds," is too low for many items, making it an unreliable estimate. Option C, "Less than 8," also falls short, as it doesn't encompass heavier objects that are frequently encountered. Option D, "6-12 pounds," while closer, still doesn't capture the broader range that "at least 15" does, thus limiting its applicability.
Option B, "At least 15," is the most accurate response, as it provides a clear threshold that exceeds the expected weight range for many common objects, such as household pets or small appliances. Option A, "4.5 pounds," is too low for many items, making it an unreliable estimate. Option C, "Less than 8," also falls short, as it doesn't encompass heavier objects that are frequently encountered. Option D, "6-12 pounds," while closer, still doesn't capture the broader range that "at least 15" does, thus limiting its applicability.
Other Related Questions
178-degree angle?
- A. Acute
- B. Obtuse
- C. Right
- D. Straight
Correct Answer & Rationale
Correct Answer: B
An angle measuring 178 degrees is classified as obtuse, as it is greater than 90 degrees but less than 180 degrees. Option A, acute, refers to angles less than 90 degrees, which does not apply here. Option C, right, denotes a 90-degree angle, clearly not fitting for 178 degrees. Option D, straight, describes a 180-degree angle, which is also not applicable since 178 degrees is slightly less than that. Thus, the only suitable classification for a 178-degree angle is obtuse.
An angle measuring 178 degrees is classified as obtuse, as it is greater than 90 degrees but less than 180 degrees. Option A, acute, refers to angles less than 90 degrees, which does not apply here. Option C, right, denotes a 90-degree angle, clearly not fitting for 178 degrees. Option D, straight, describes a 180-degree angle, which is also not applicable since 178 degrees is slightly less than that. Thus, the only suitable classification for a 178-degree angle is obtuse.
Associative operations? Select ALL.
- A. Addition
- B. Subtraction
- C. Multiplication
- D. Division
- E. Exponentiation
Correct Answer & Rationale
Correct Answer: A,C
Associative operations allow the grouping of numbers in different ways without changing the result. Addition (A) and multiplication (C) are associative; for example, (a + b) + c = a + (b + c) and (a × b) × c = a × (b × c). Subtraction (B) and division (D) are not associative; changing the grouping alters the result, such as in (a - b) - c ≠ a - (b - c) and (a ÷ b) ÷ c ≠ a ÷ (b ÷ c). Exponentiation (E) is also not associative, as (a^b)^c ≠ a^(b^c). Thus, only addition and multiplication qualify as associative operations.
Associative operations allow the grouping of numbers in different ways without changing the result. Addition (A) and multiplication (C) are associative; for example, (a + b) + c = a + (b + c) and (a × b) × c = a × (b × c). Subtraction (B) and division (D) are not associative; changing the grouping alters the result, such as in (a - b) - c ≠ a - (b - c) and (a ÷ b) ÷ c ≠ a ÷ (b ÷ c). Exponentiation (E) is also not associative, as (a^b)^c ≠ a^(b^c). Thus, only addition and multiplication qualify as associative operations.
3(2x+5)+4x+7?
- A. 6x+12
- B. 10x+22
- C. 10x+12
- D. 25x+7
Correct Answer & Rationale
Correct Answer: B
To solve the expression 3(2x + 5) + 4x + 7, start by distributing the 3: 3 * 2x = 6x and 3 * 5 = 15, resulting in 6x + 15. Next, combine this with the other terms: 6x + 15 + 4x + 7. Combining like terms gives: (6x + 4x) + (15 + 7) = 10x + 22. Option A (6x + 12) incorrectly simplifies the expression. Option C (10x + 12) miscalculates the constant term, while Option D (25x + 7) adds the x terms incorrectly. Thus, option B accurately represents the simplified expression.
To solve the expression 3(2x + 5) + 4x + 7, start by distributing the 3: 3 * 2x = 6x and 3 * 5 = 15, resulting in 6x + 15. Next, combine this with the other terms: 6x + 15 + 4x + 7. Combining like terms gives: (6x + 4x) + (15 + 7) = 10x + 22. Option A (6x + 12) incorrectly simplifies the expression. Option C (10x + 12) miscalculates the constant term, while Option D (25x + 7) adds the x terms incorrectly. Thus, option B accurately represents the simplified expression.
Which would be read as 'two million three hundred six thousand nine hundred thirty-four'?
- A. 2,036,934
- B. 2,306,934
- C. 2,360,934
- D. 2,369.03
Correct Answer & Rationale
Correct Answer: B
Option B, 2,306,934, accurately represents 'two million three hundred six thousand nine hundred thirty-four.' The number is broken down as follows: 2 million (2,000,000), 300 thousand (300,000), 6 thousand (6,000), 900 (900), and 30 (30), culminating in 2,306,934. Option A, 2,036,934, incorrectly includes only 30 thousand instead of 300 thousand. Option C, 2,360,934, misplaces the hundreds, showing 360 thousand instead of 306 thousand. Option D, 2,369.03, is not a whole number representation and introduces decimal values, which are irrelevant in this context.
Option B, 2,306,934, accurately represents 'two million three hundred six thousand nine hundred thirty-four.' The number is broken down as follows: 2 million (2,000,000), 300 thousand (300,000), 6 thousand (6,000), 900 (900), and 30 (30), culminating in 2,306,934. Option A, 2,036,934, incorrectly includes only 30 thousand instead of 300 thousand. Option C, 2,360,934, misplaces the hundreds, showing 360 thousand instead of 306 thousand. Option D, 2,369.03, is not a whole number representation and introduces decimal values, which are irrelevant in this context.