A salesperson's commission is k percent of the selling price of a car. Which of the following represents the commission, in dollars, on 2 cars that sold for $14,000 each?
- A. 280k
- B. 28,000k
- C. 14,000/(100+2k)
- D. (28,000+k)/100
Correct Answer & Rationale
Correct Answer: A
To determine the commission on 2 cars sold for $14,000 each, first calculate the total selling price: 2 × $14,000 = $28,000. The commission, being k percent of this total, is expressed as (k/100) × $28,000, which simplifies to $280k. Option B, 28,000k, incorrectly suggests the commission is k percent of the total without dividing by 100. Option C, 14,000/(100+2k), misrepresents the calculation entirely by altering the formula. Option D, (28,000+k)/100, incorrectly adds k to the total selling price before calculating the percentage, which is not aligned with commission calculation principles.
To determine the commission on 2 cars sold for $14,000 each, first calculate the total selling price: 2 × $14,000 = $28,000. The commission, being k percent of this total, is expressed as (k/100) × $28,000, which simplifies to $280k. Option B, 28,000k, incorrectly suggests the commission is k percent of the total without dividing by 100. Option C, 14,000/(100+2k), misrepresents the calculation entirely by altering the formula. Option D, (28,000+k)/100, incorrectly adds k to the total selling price before calculating the percentage, which is not aligned with commission calculation principles.
Other Related Questions
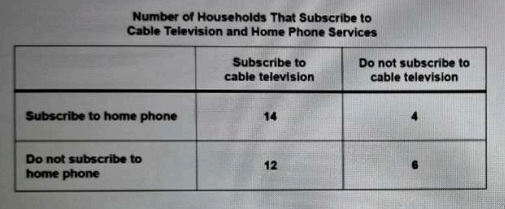
Malia collected information about whether the members of the 36 households on her block subscribed to cable television and home phone services. Her results are shown in the table below.\nIf a household on Malia's block is selected at random and does subscribe to cable television, what is the probability the members of the household also subscribe to home phone service?
- A. 14/18
- B. 14/26
- C. 18/36
- D. 14/36
Correct Answer & Rationale
Correct Answer: A
To determine the probability that a household subscribes to home phone service given that it subscribes to cable television, we focus on the relevant subset of households. Malia found 18 households that subscribe to cable, out of which 14 also subscribe to home phone service. Thus, the probability is calculated as the number of households with both services (14) divided by the total number of households with cable (18), resulting in 14/18. Option B (14/26) incorrectly uses the total number of households with home phone service instead of just those with cable. Option C (18/36) misinterprets the probability as a ratio of all households rather than those who subscribe to cable. Option D (14/36) inaccurately represents the total number of households instead of focusing on the cable subscribers.
To determine the probability that a household subscribes to home phone service given that it subscribes to cable television, we focus on the relevant subset of households. Malia found 18 households that subscribe to cable, out of which 14 also subscribe to home phone service. Thus, the probability is calculated as the number of households with both services (14) divided by the total number of households with cable (18), resulting in 14/18. Option B (14/26) incorrectly uses the total number of households with home phone service instead of just those with cable. Option C (18/36) misinterprets the probability as a ratio of all households rather than those who subscribe to cable. Option D (14/36) inaccurately represents the total number of households instead of focusing on the cable subscribers.
0.034÷(10)^(-1) =
- A. 0.0034
- B. 0.034
- C. 0.34
- D. 3.4
Correct Answer & Rationale
Correct Answer: C
To solve 0.034 ÷ (10)^(-1), we first recognize that (10)^(-1) is equivalent to 1/10 or 0.1. Dividing by 0.1 is the same as multiplying by 10. Therefore, 0.034 ÷ 0.1 equals 0.034 × 10, which results in 0.34. Option A (0.0034) misinterprets the division, mistakenly moving the decimal too far left. Option B (0.034) fails to account for the division by 0.1, leaving the original number unchanged. Option D (3.4) incorrectly multiplies instead of dividing, moving the decimal point too far right. Thus, the only accurate calculation leads to 0.34.
To solve 0.034 ÷ (10)^(-1), we first recognize that (10)^(-1) is equivalent to 1/10 or 0.1. Dividing by 0.1 is the same as multiplying by 10. Therefore, 0.034 ÷ 0.1 equals 0.034 × 10, which results in 0.34. Option A (0.0034) misinterprets the division, mistakenly moving the decimal too far left. Option B (0.034) fails to account for the division by 0.1, leaving the original number unchanged. Option D (3.4) incorrectly multiplies instead of dividing, moving the decimal point too far right. Thus, the only accurate calculation leads to 0.34.
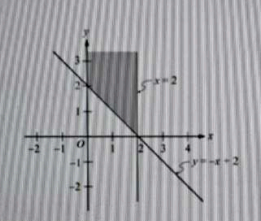
Which of the following points lies in the shaded region of the xy -plane above?
- A. (-1,1)
- B. (0,1)
- C. (1,2)
- D. (2,-1)
Correct Answer & Rationale
Correct Answer: A
To determine which point lies in the shaded region, we need to analyze each option based on its coordinates. Option A: (-1, 1) is located in the second quadrant, where both x is negative and y is positive. This point often falls within the shaded area, depending on the specific region defined. Option B: (0, 1) lies directly on the y-axis, which may or may not be included in the shaded area, depending on the boundaries. Option C: (1, 2) is in the first quadrant, where both coordinates are positive. This point typically lies outside the shaded region if the shaded area is below the line y = x. Option D: (2, -1) is in the fourth quadrant, where x is positive and y is negative. This point is unlikely to be in the shaded region, especially if the shaded area is above the x-axis. Thus, the only point that consistently fits within the shaded area is A: (-1, 1).
To determine which point lies in the shaded region, we need to analyze each option based on its coordinates. Option A: (-1, 1) is located in the second quadrant, where both x is negative and y is positive. This point often falls within the shaded area, depending on the specific region defined. Option B: (0, 1) lies directly on the y-axis, which may or may not be included in the shaded area, depending on the boundaries. Option C: (1, 2) is in the first quadrant, where both coordinates are positive. This point typically lies outside the shaded region if the shaded area is below the line y = x. Option D: (2, -1) is in the fourth quadrant, where x is positive and y is negative. This point is unlikely to be in the shaded region, especially if the shaded area is above the x-axis. Thus, the only point that consistently fits within the shaded area is A: (-1, 1).
If |x|+|y| = 4 and x ≠y, then x CANNOT be equal to
- A. 2
- C. -2
- D. -5
Correct Answer & Rationale
Correct Answer: D
The equation |x| + |y| = 4 defines a diamond-shaped region in the coordinate plane, where the sum of the absolute values of x and y equals 4. Option A (2) is possible since |2| + |y| = 4 allows y to be 2 or -2. Option C (-2) is also valid, as |-2| + |y| = 4 permits y to be 2 or -2. Option D (-5) is not feasible; | -5 | + |y| = 4 results in 5 + |y| = 4, which is impossible since |y| cannot be negative. Thus, -5 cannot satisfy the given equation while ensuring x ≠ y.
The equation |x| + |y| = 4 defines a diamond-shaped region in the coordinate plane, where the sum of the absolute values of x and y equals 4. Option A (2) is possible since |2| + |y| = 4 allows y to be 2 or -2. Option C (-2) is also valid, as |-2| + |y| = 4 permits y to be 2 or -2. Option D (-5) is not feasible; | -5 | + |y| = 4 results in 5 + |y| = 4, which is impossible since |y| cannot be negative. Thus, -5 cannot satisfy the given equation while ensuring x ≠ y.