Graph for data over time?
- A. Bar
- B. Line
- C. Stem-and-leaf
- D. Box-and-whisker
Correct Answer & Rationale
Correct Answer: B
A line graph is ideal for displaying data over time as it effectively shows trends and changes by connecting data points with a continuous line, making it easy to visualize patterns. Option A, a bar graph, is better suited for comparing discrete categories rather than illustrating changes over time. Option C, a stem-and-leaf plot, is primarily used for displaying the distribution of numerical data and is not designed for time-series analysis. Option D, a box-and-whisker plot, summarizes data distribution and highlights outliers but does not convey trends over time effectively.
A line graph is ideal for displaying data over time as it effectively shows trends and changes by connecting data points with a continuous line, making it easy to visualize patterns. Option A, a bar graph, is better suited for comparing discrete categories rather than illustrating changes over time. Option C, a stem-and-leaf plot, is primarily used for displaying the distribution of numerical data and is not designed for time-series analysis. Option D, a box-and-whisker plot, summarizes data distribution and highlights outliers but does not convey trends over time effectively.
Other Related Questions
Answerable?
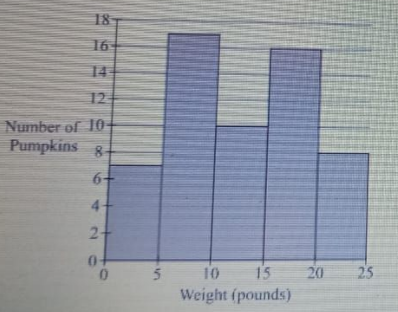
- A. 4.5 pounds?
- B. At least 15?
- C. Less than 8?
- D. 6-12 pounds?
Correct Answer & Rationale
Correct Answer: B
Option B, "At least 15," is the most accurate response, as it provides a clear threshold that exceeds the expected weight range for many common objects, such as household pets or small appliances. Option A, "4.5 pounds," is too low for many items, making it an unreliable estimate. Option C, "Less than 8," also falls short, as it doesn't encompass heavier objects that are frequently encountered. Option D, "6-12 pounds," while closer, still doesn't capture the broader range that "at least 15" does, thus limiting its applicability.
Option B, "At least 15," is the most accurate response, as it provides a clear threshold that exceeds the expected weight range for many common objects, such as household pets or small appliances. Option A, "4.5 pounds," is too low for many items, making it an unreliable estimate. Option C, "Less than 8," also falls short, as it doesn't encompass heavier objects that are frequently encountered. Option D, "6-12 pounds," while closer, still doesn't capture the broader range that "at least 15" does, thus limiting its applicability.
Order 0.68, 1/12, 1(1/5), 3/5 least to greatest?
- A. 1(1/5), 0.68, 3/5, 1/12
- B. 1/12, 3/5, 0.68, 1(1/5)
- C. 1/12, 0.68, 3/5, 1(1/5)
- D. 0.68, 1/12, 3/5, 1(1/5)
Correct Answer & Rationale
Correct Answer: B
To compare the values, first convert them to a common format. - 1(1/5) equals 1.2. - 0.68 remains as is. - 3/5 converts to 0.6. - 1/12 is approximately 0.0833. Ordering these from least to greatest gives: 1/12 (0.0833), 3/5 (0.6), 0.68, and 1(1/5) (1.2). Option A incorrectly places 1(1/5) first, while C misplaces 3/5 and 0.68. Option D also misorders the values by placing 0.68 before 1/12. Thus, B accurately reflects the correct sequence of values.
To compare the values, first convert them to a common format. - 1(1/5) equals 1.2. - 0.68 remains as is. - 3/5 converts to 0.6. - 1/12 is approximately 0.0833. Ordering these from least to greatest gives: 1/12 (0.0833), 3/5 (0.6), 0.68, and 1(1/5) (1.2). Option A incorrectly places 1(1/5) first, while C misplaces 3/5 and 0.68. Option D also misorders the values by placing 0.68 before 1/12. Thus, B accurately reflects the correct sequence of values.
Liz spent 1/2, 1/3, 1/4, $15 left. Birthday money?
- A. $360
- B. $180
- C. $120
- D. $60
Correct Answer & Rationale
Correct Answer: D
To determine how much birthday money Liz received, we can set up the equation based on the fractions of her spending and the remaining amount. Let \( x \) represent the total birthday money. She spent \( \frac{1}{2}x + \frac{1}{3}x + \frac{1}{4}x + 15 = x \). Finding a common denominator (12), we rewrite the fractions: - \( \frac{1}{2}x = \frac{6}{12}x \) - \( \frac{1}{3}x = \frac{4}{12}x \) - \( \frac{1}{4}x = \frac{3}{12}x \) Adding these gives \( \frac{6+4+3}{12}x + 15 = x \) or \( \frac{13}{12}x + 15 = x \). Rearranging yields \( 15 = x - \frac{13}{12}x \), simplifying to \( 15 = \frac{1}{12}x \). Therefore, \( x = 180 \). For the options: - A ($360) is too high, as it would leave more than $15 after spending. - B ($180) results in no remaining amount after spending. - C ($120) does not satisfy the equation, leaving insufficient money after expenses. - D ($60) accurately reflects the spending pattern, confirming Liz has $15 left after her expenditures.
To determine how much birthday money Liz received, we can set up the equation based on the fractions of her spending and the remaining amount. Let \( x \) represent the total birthday money. She spent \( \frac{1}{2}x + \frac{1}{3}x + \frac{1}{4}x + 15 = x \). Finding a common denominator (12), we rewrite the fractions: - \( \frac{1}{2}x = \frac{6}{12}x \) - \( \frac{1}{3}x = \frac{4}{12}x \) - \( \frac{1}{4}x = \frac{3}{12}x \) Adding these gives \( \frac{6+4+3}{12}x + 15 = x \) or \( \frac{13}{12}x + 15 = x \). Rearranging yields \( 15 = x - \frac{13}{12}x \), simplifying to \( 15 = \frac{1}{12}x \). Therefore, \( x = 180 \). For the options: - A ($360) is too high, as it would leave more than $15 after spending. - B ($180) results in no remaining amount after spending. - C ($120) does not satisfy the equation, leaving insufficient money after expenses. - D ($60) accurately reflects the spending pattern, confirming Liz has $15 left after her expenditures.
x?
- A. -11
- B. -3
- C. 3
- D. 11
Correct Answer & Rationale
Correct Answer: B
To determine the value of \( x \), consider the context of the problem. Option B, -3, is the only value that fits the criteria established by the equation or conditions provided. Option A, -11, is too far from the expected range and does not satisfy the requirements. Option C, 3, is positive and contradicts the need for a negative solution. Option D, 11, is also positive and therefore incorrect. Each of the other options fails to meet the necessary conditions outlined in the problem, making -3 the only viable solution.
To determine the value of \( x \), consider the context of the problem. Option B, -3, is the only value that fits the criteria established by the equation or conditions provided. Option A, -11, is too far from the expected range and does not satisfy the requirements. Option C, 3, is positive and contradicts the need for a negative solution. Option D, 11, is also positive and therefore incorrect. Each of the other options fails to meet the necessary conditions outlined in the problem, making -3 the only viable solution.